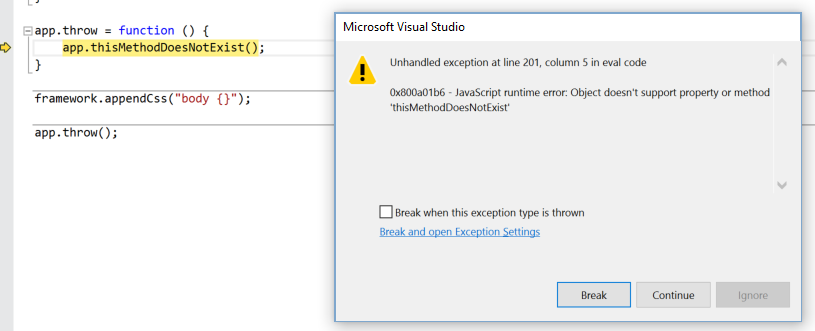
The biggest challenge when working with a C# app that invokes JavaScript functions is that the debugger by default will only attach to the C# code and show an unhandled exception that isn’t very helpful any time something goes wrong in JavaScript:

In Visual Studio 2015, the solution for this is to switch debugging modes so that instead of the debugger monitoring our managed C# code, it’s monitoring our JS context instead.
You can do this by setting the Application process under Debugger type to Script:

Now when you debug the app and run into a JS exception, the debugger will stop and you’ll have full code context:

This includes inspecting the values of variables, stepping into/out of code and doing basically anything you’d normally want to do with the debugger in a JS app.