A good Hybrid WebApp is one that feels more app than website and most importantly, presents a compelling reason to use the app instead of opening the website in a browser.
Lets avoid creating websites in a box, ok?
In order to become masters of our craft and create a great experience for our end users, we’ll need a solid understanding of the website the app will be based on.
As we don’t always have access to server-side code or an ability to customise the delivery of the website to better suit our app, this typically results in a trip to the DOM Inspector and Javascript console to:
- Decide which elements don’t make sense in our app. These typically include footers, links to download apps (we’re already in an app!), navigation items, etc
- Decide which features of a native app, such as secondary tile pinning, background audio, etc make sense to support
- Look for nice JavaScript objects that we can reuse as data sources for our app (ie: model objects)
- Look for nice JavaScript functions that we can call to perform tasks such as authentication
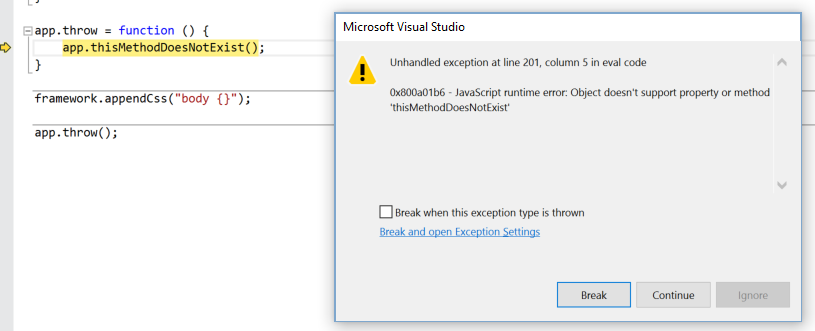
The way I typically do this is a combination of the IE dev tools:

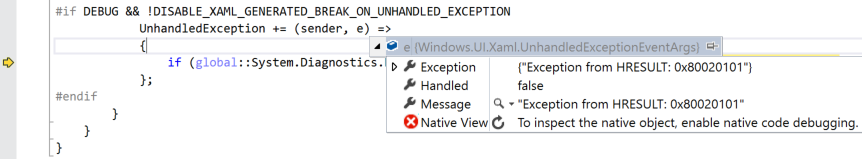
And Visual Studio DOM Explorer:

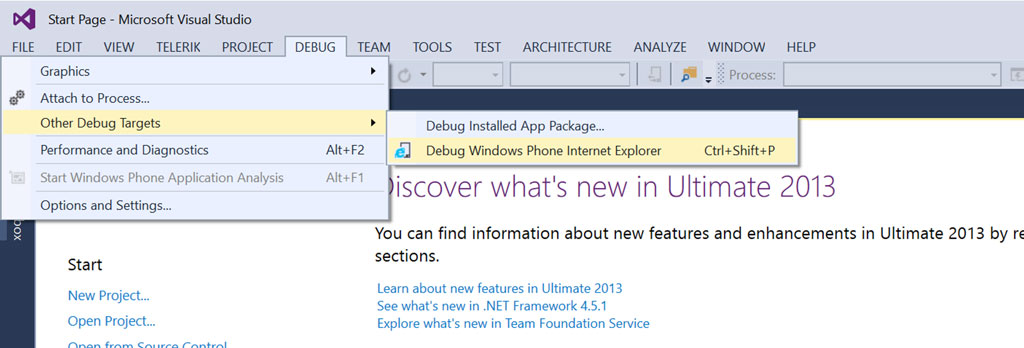
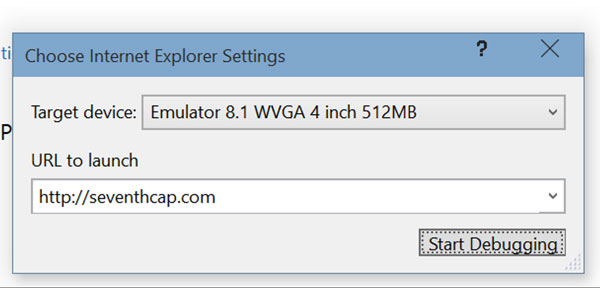
For Windows Phone I tend to use the Visual Studio DOM explorer more as it loads the site in the emulator, if you weren’t aware you can debug a website in any of the Windows Phone emulators via:
Once we have an idea of our integration, start mocking it up live in the tools mentioned above (IE Dev tools, DOM Explorer).
In practice my environment looks something like this when I’m starting to work on a new Hybrid WebApp (although usually across multiple screens):

Then as I work out a new style change, I copy it over to app.css. Likewise for scripts, which end up in app.js.